



Every conversation about inflation ends the same way. Someone says "prices are just going up," everyone nods, and the topic dies.
Inflation is at least seventeen distinct mechanisms, each with a different cause, a different fix, and a different set of losers. Confuse two of them and you save in the wrong asset, back the wrong policy, or panic at the wrong number.

All Seventeen, on One Screen
Here is the whole map before the detail. Every row is a different mechanism with a different fix, and the third column is the one people skip.

Seventeen flat definitions are still a list, so the rest of this post groups them by where the pressure originates. Five families, and each family has its own fix.
Family 1. The Two Lenses You Are Shown
Before any argument about causes, there are two numbers, and almost every public disagreement about inflation is really a disagreement about which one to look at.
Headline vs. Core Inflation Is Two Different Questions
Headline inflation is the total number on the news. It includes energy, food, and housing, everything that moves the price level.
Core inflation strips out food and energy because those two categories swing on their own, for reasons that have nothing to do with the rest of the economy, and central bankers need to see the trend underneath that noise. Since 1983, core PCE (Personal Consumption Expenditures) inflation in the US has averaged 2.4%.
That average holds until a shock breaks it. In 2022, when Russia invaded Ukraine, headline inflation spiked while core barely moved. The gap between the two numbers told you the shock was external, not something the Fed's own policy had caused.

Family 2. Too Much Money Chasing Too Few Goods
These five start on the demand side. Money enters the economy faster than the economy can make things to spend it on, and the real question is who put it there.
Monetary Inflation AKA the Money-Printer Story
The Great Inflation ran from 1965 to 1982, and it is the standard case for monetary inflation: the Federal Reserve held an expansionary policy for years, and inflation topped 14% in 1980. It took Fed chair Paul Volcker's tightening, and the recession that followed, to break it.
This is the version of inflation most people already understand. Print money and prices rise. That story explains two of the seventeen types on this list, but it does not explain the other fifteen.

Fiscal Inflation AKA Guns, Butter, and No New Taxes
The 1960s and 70s ran on a phrase: "guns and butter." The government funded the Vietnam War and the Great Society at the same time, and it never raised taxes enough to cover either one.
That gap is fiscal inflation: government spending outpaces revenue, the central bank accommodates the deficit instead of fighting it, and the extra money flows into the economy faster than goods and services can absorb it. Spending is the easy political choice, and taxing is the hard one, so the price level absorbs the gap between them.

Wage Inflation Turns Your Own Raise Into the Problem
Wages that rise faster than productivity become a cost, and firms price that cost into what they sell. That is wage inflation, and it behaves worse than it sounds.
In 2021, post-pandemic labor shortages tightened the US job market fast: unemployment fell from double digits in 2020 to under 4% by year-end 2021, and job openings outnumbered available workers. Businesses raised prices to cover the added labor cost. Nobody had to act greedy for the wage-price spiral to start. It only needed the math to run that way.

Asset Inflation Makes Owners Richer and Renters Feel Poorer
Between 2002 and 2006, US housing prices exploded, and wages were not the reason. Asset inflation is what happens when the price of things you buy to get richer (stocks, houses, crypto) rises faster than the price of things you buy to live.
It feels like prosperity until you try to buy a house and find the market moved without you. Your wages can keep pace with headline inflation and you still end up poorer, because the assets priced you out while your paycheck looked fine.

Reflation AKA the Inflation FDR Started on Purpose
After the Great Depression, the US faced the opposite problem: prices were falling, debts were getting heavier in real terms, and the economy was spiraling toward collapse.
The New Deal was a reflationary policy: deliberately stoking inflation to escape deflation. Between 1933 and 1938, the government spent, the Fed expanded the money supply, and prices started rising again.
Reflation is the inflation you choose because the alternative, a deflationary spiral, is worse. It is inflation used as treatment, not the disease.

Family 3. When the Shock Arrives From Outside
Nobody in the country printed money or overheated demand for these four. Something the economy depends on got expensive somewhere else, and this is what that looks like on the way through.
Imported Inflation Is Someone Else's Shock on Your Receipt
America did not cause the 1973 oil embargo. It paid for it anyway. OPEC cut supply, and oil went from $2.90 a barrel to $11.65 by January 1974, quadrupling energy costs for every oil-importing nation.
That is imported inflation: your domestic prices rise because something you buy abroad got more expensive, and no domestic policy caused it. The bad luck is structural. You needed something, and the price of it moved somewhere else first.

Agflation AKA When Food Itself Drives the Index
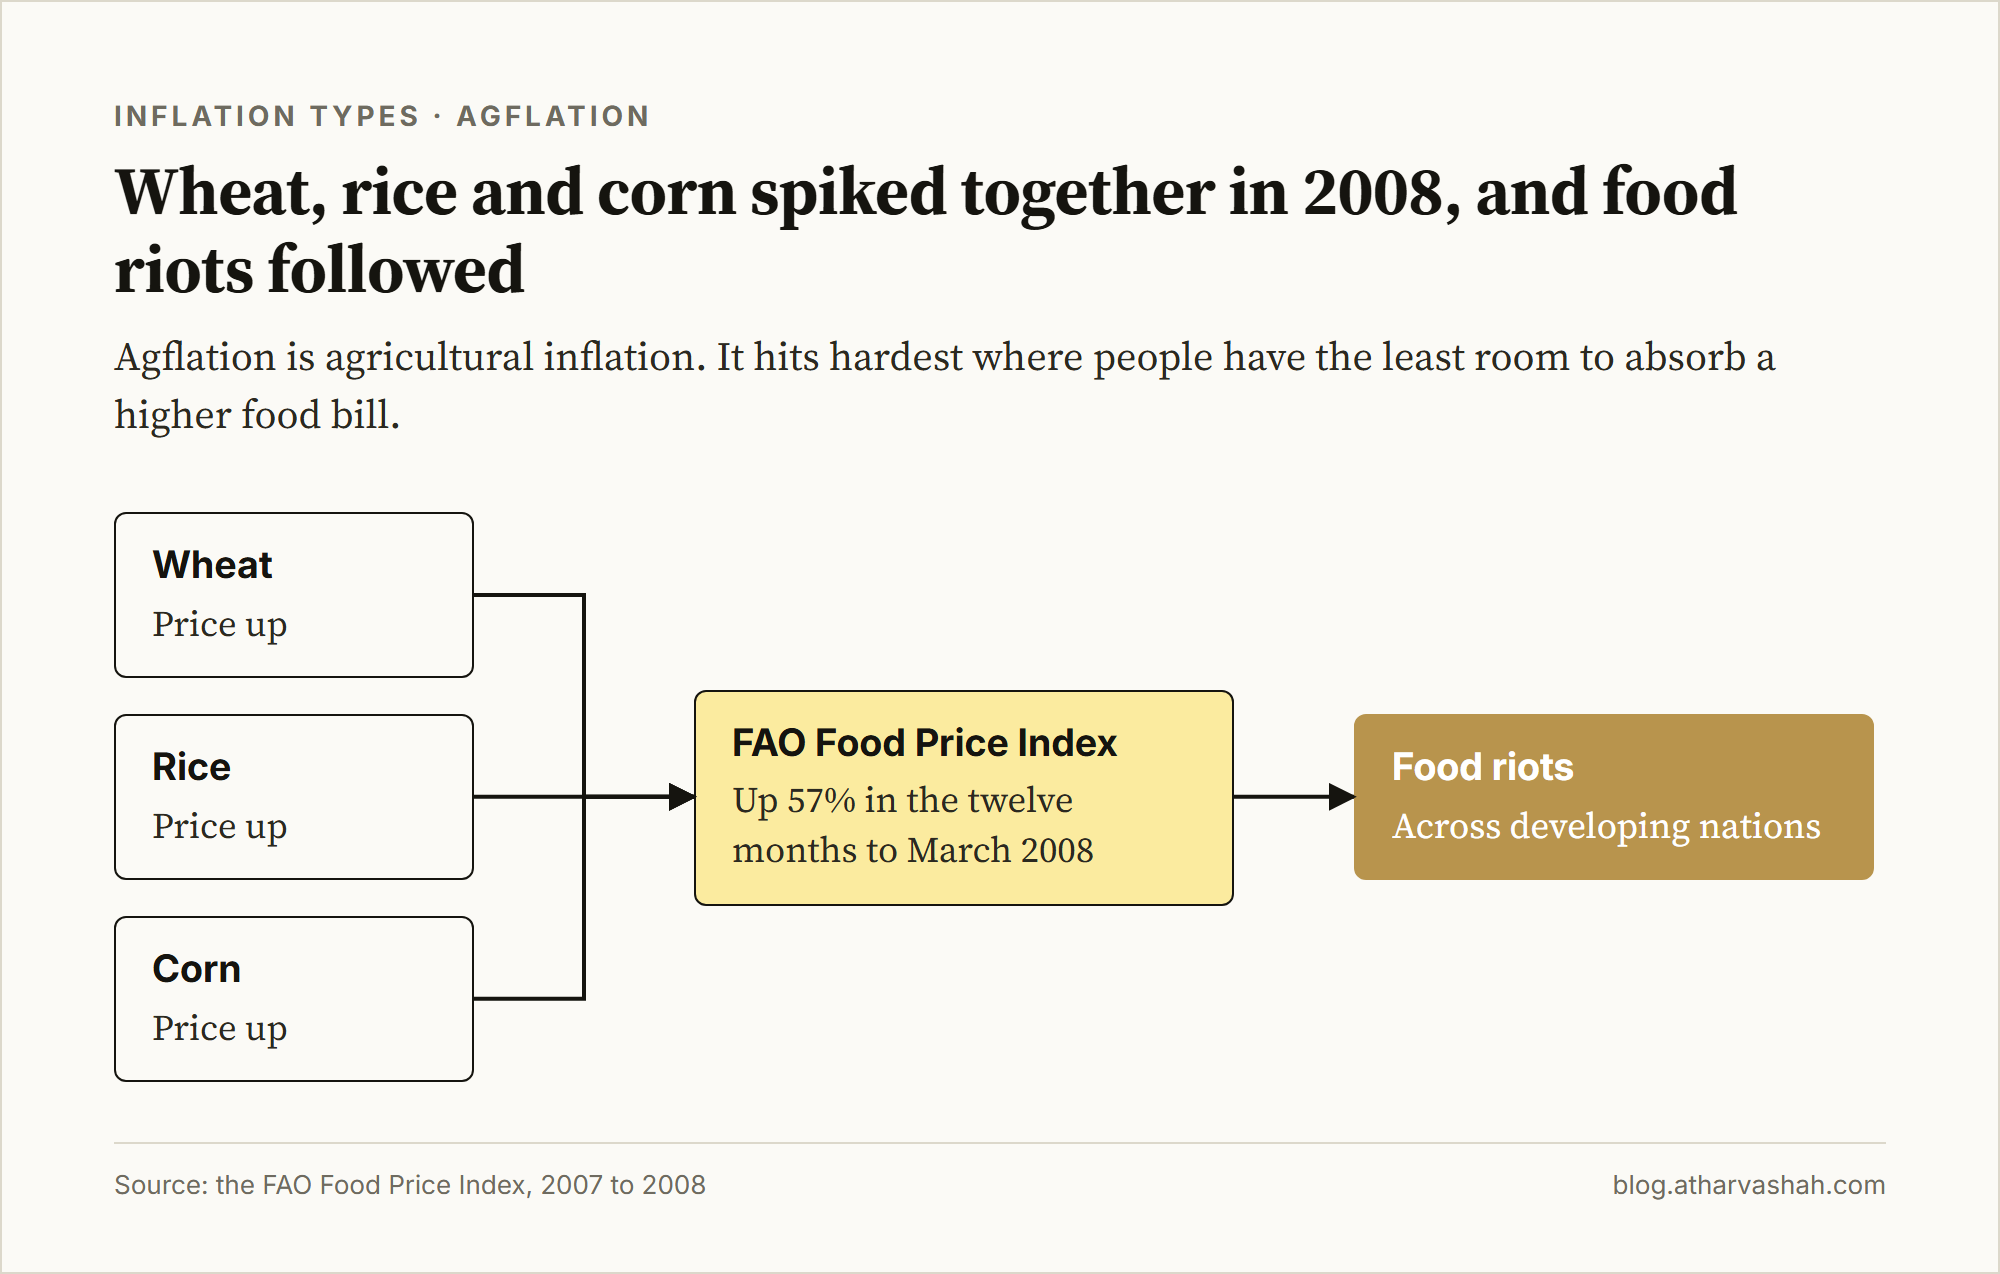
In 2007 and 2008, global food prices surged. The FAO Food Price Index rose 57% in the twelve months to March 2008, with wheat, rice, and corn spiking together, and food riots broke out across developing nations.
Agflation is agricultural inflation, and it lands hardest on the people with the least room to absorb it. A rich country complains about a grocery bill. A poor country faces actual hunger, which is why agflation is the most politically destabilizing type on this list: food is not something you can wait out.
Stagflation Is the Word the 1970s Had to Invent
The standard models said high inflation, stagnant growth, and rising unemployment could not happen at the same time. The 1970s ran all three together, for a decade.
The 1970s oil crisis broke the economic models that were supposed to prevent this: inflation ran in the double digits, GDP stalled, and unemployment kept climbing anyway. Paul Volcker had to induce a recession on purpose to kill it, which shows how deep the problem had gotten.

Slumpflation AKA Stagflation's Milder, Meaner Cousin
Slumpflation is inflation that keeps running through an actual contraction, not just stagnation. In 2022 and 2023, global growth slowed while energy shocks kept prices high: economies cooled, but prices kept climbing anyway, the same bind as the 1970s, only less severe.

Family 4. When Policy Is the Cause
These three exist because a government decision, taken for reasons that may be perfectly good, shows up on your receipt. An interest rate cannot fix any of them, because a rate was never the cause.
Greensflation Is the Carbon Price on Your Electricity Bill
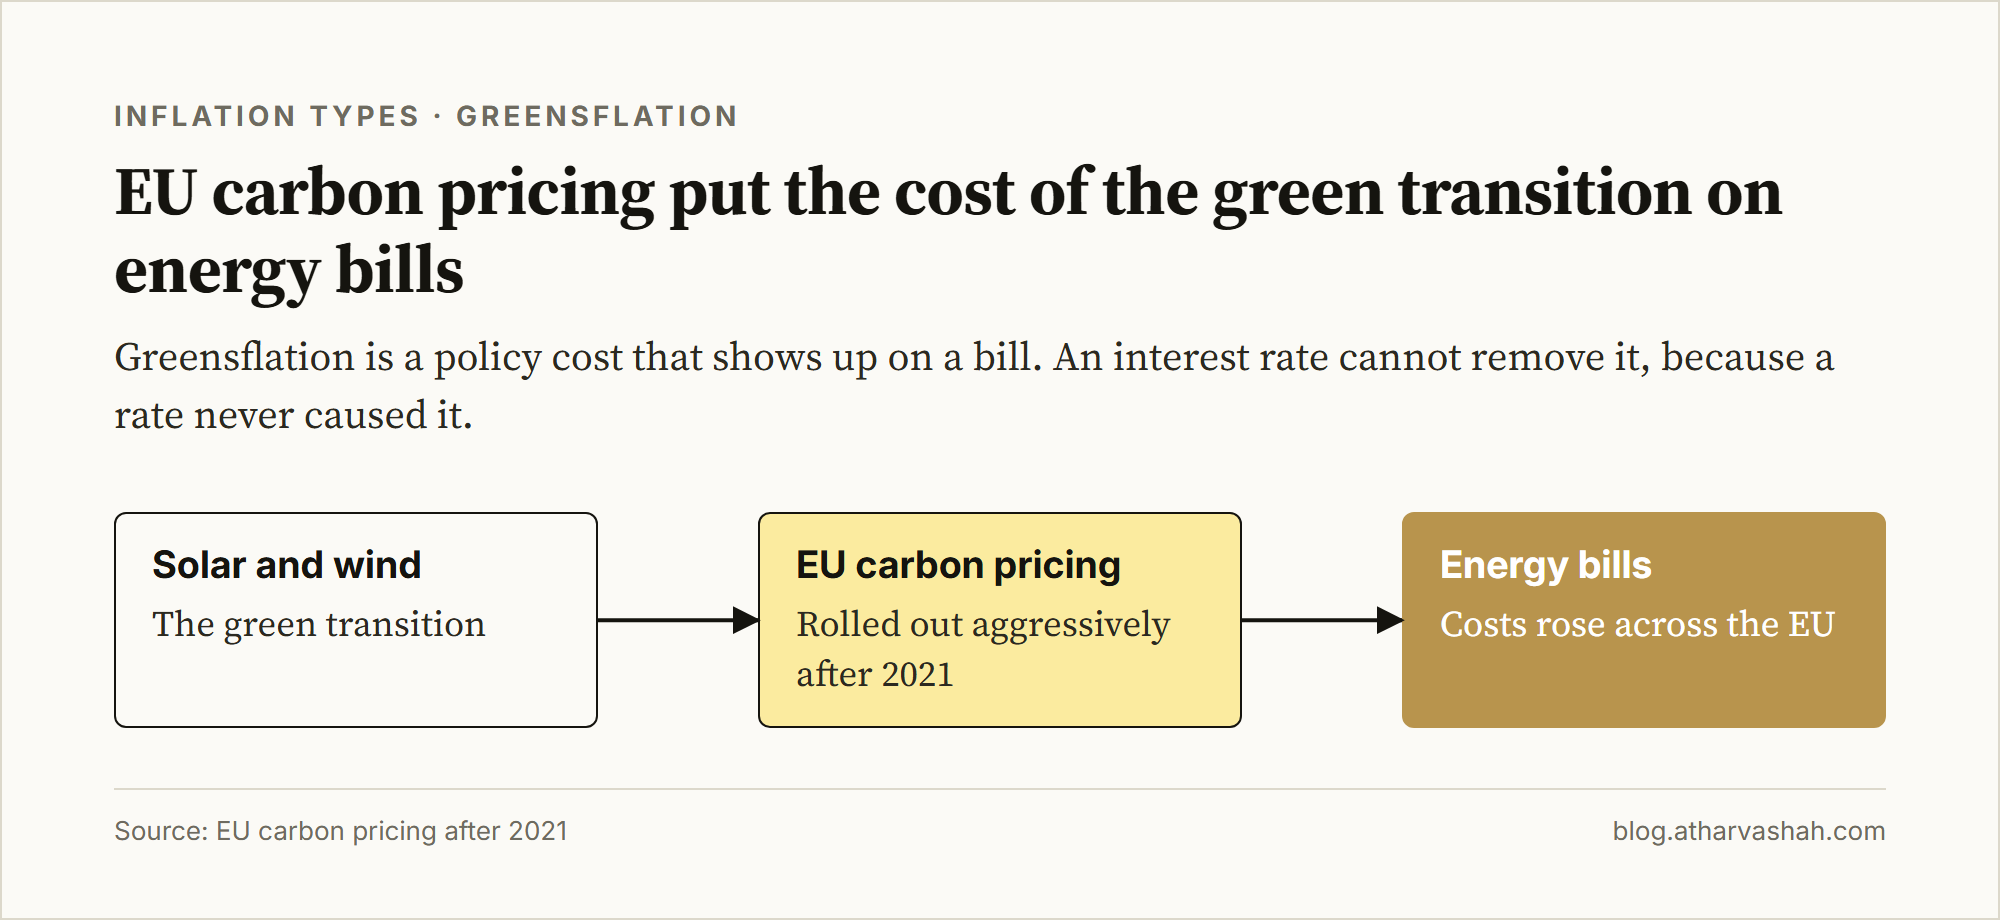
After 2021, the EU rolled out aggressive carbon pricing, and energy costs rose across the bloc. This is greensflation: the cost of the transition to green energy showing up in a bill, not in a supply shock and not in anyone's greed.
Whether the transition is worth that cost is a separate question. Policy put that cost on the bill, not the market.
Taxflation AKA the Tax Hike That Shows up on the Shelf
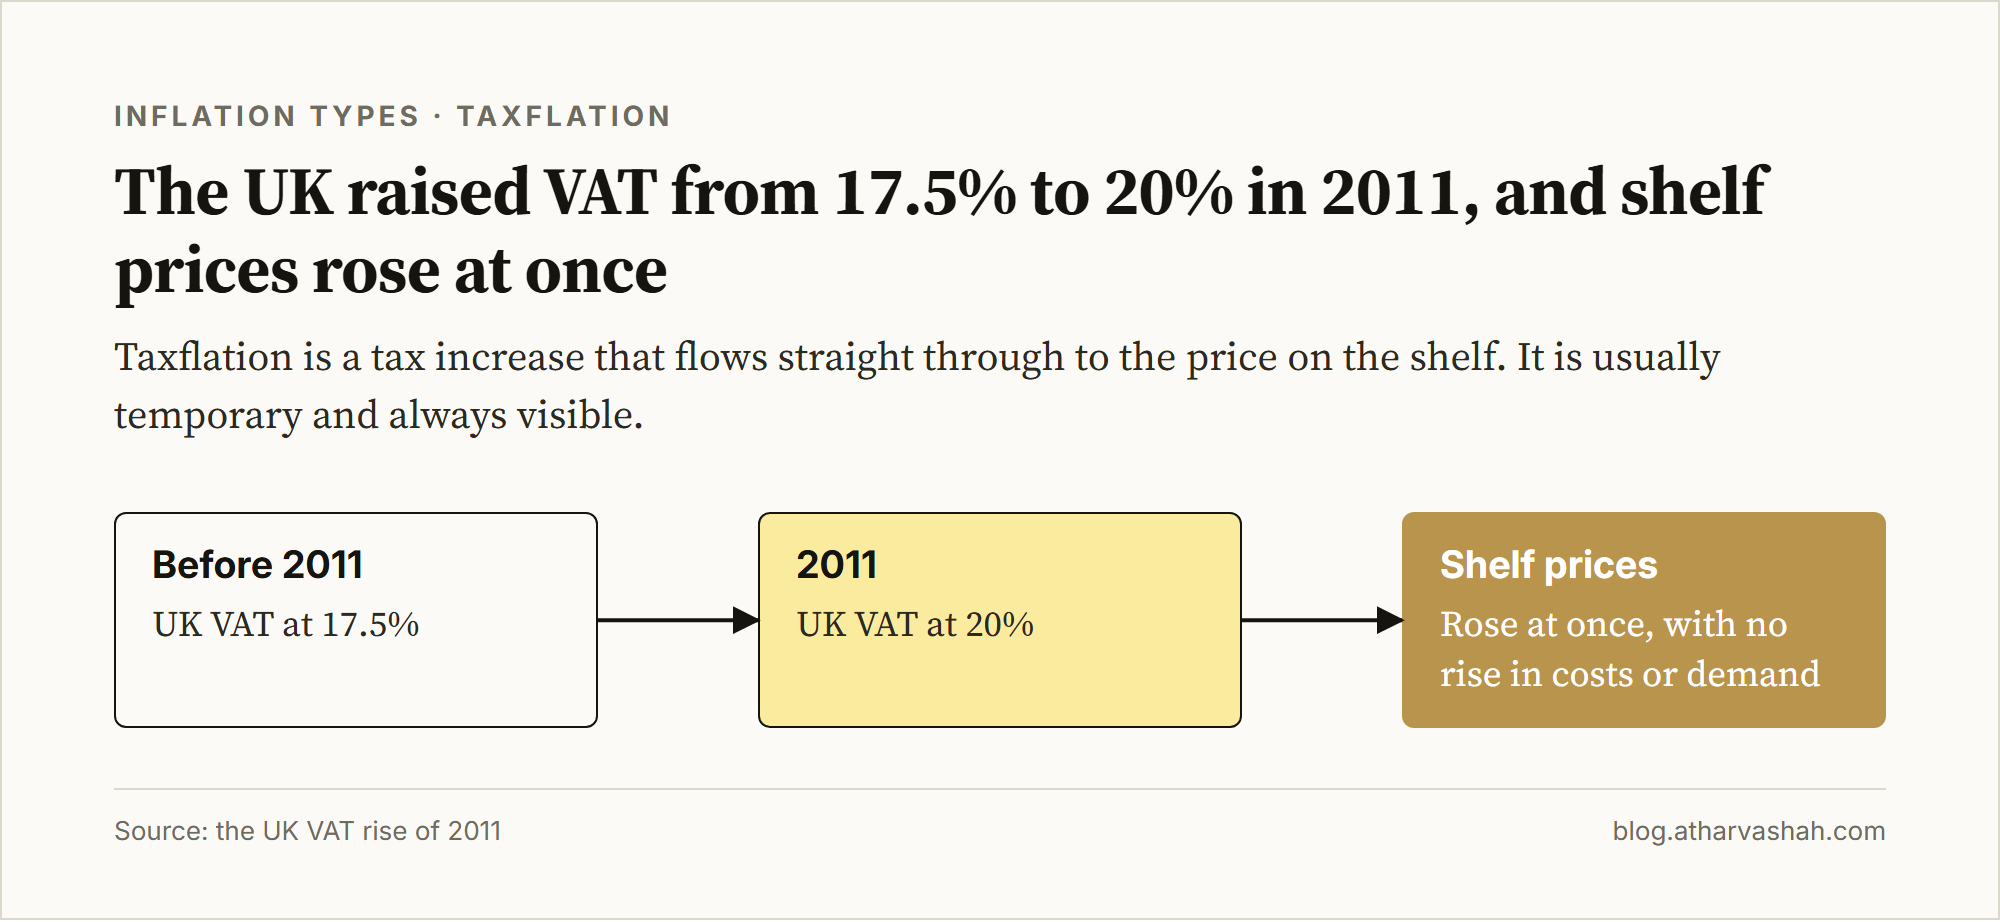
In 2011, the UK raised its Value Added Tax from 17.5% to 20%, and prices rose immediately, not because costs had increased and not because demand had surged.
Taxflation is what happens when a tax increase flows straight through to the price on the shelf. It is usually temporary, it is always visible, and it is the one type of inflation a government cannot blame on the market.
Suppressed Inflation Goes Underground Until It Doesn't
In the Soviet Union through the 1970s and 80s, official prices barely moved while the shelves emptied, rationing spread, and black markets charged ten times the official price for the same goods.
That is suppressed inflation: government price controls hide the real pressure instead of releasing it. The pressure does not disappear. It goes underground, and it surfaces all at once on the day the controls finally break.

Family 5. When the Seller Moves Instead of the Price
The last three never show up cleanly in the index, because the sticker price is the one thing that did not change. This is the family you feel first and measure last.
Shrinkflation AKA the Same Price in a Smaller Box
In the 2010s, Frosted Flakes boxes shrank from 24 ounces to 21.7 ounces while the price held. That is shrinkflation, and it works precisely because almost nobody checks the unit price.
A study published in the INFORMS journal Marketing Science, by Aljoscha Janssen of Singapore Management University and Johannes Kasinger of Tilburg University, put a number on the mechanism. Across a decade of US retail scanner data, 1.92% of products were downsized, more than five times the rate of upsizing, and the average downsize raised the price per unit by 12%. Shoppers barely reacted: a 1% price increase cuts sales by about 1.19%, while a 1% size cut only trims sales by 0.56%, under half as much pushback for the same effective price hike.

Skimpflation Is What Happens When the Price Can't Move
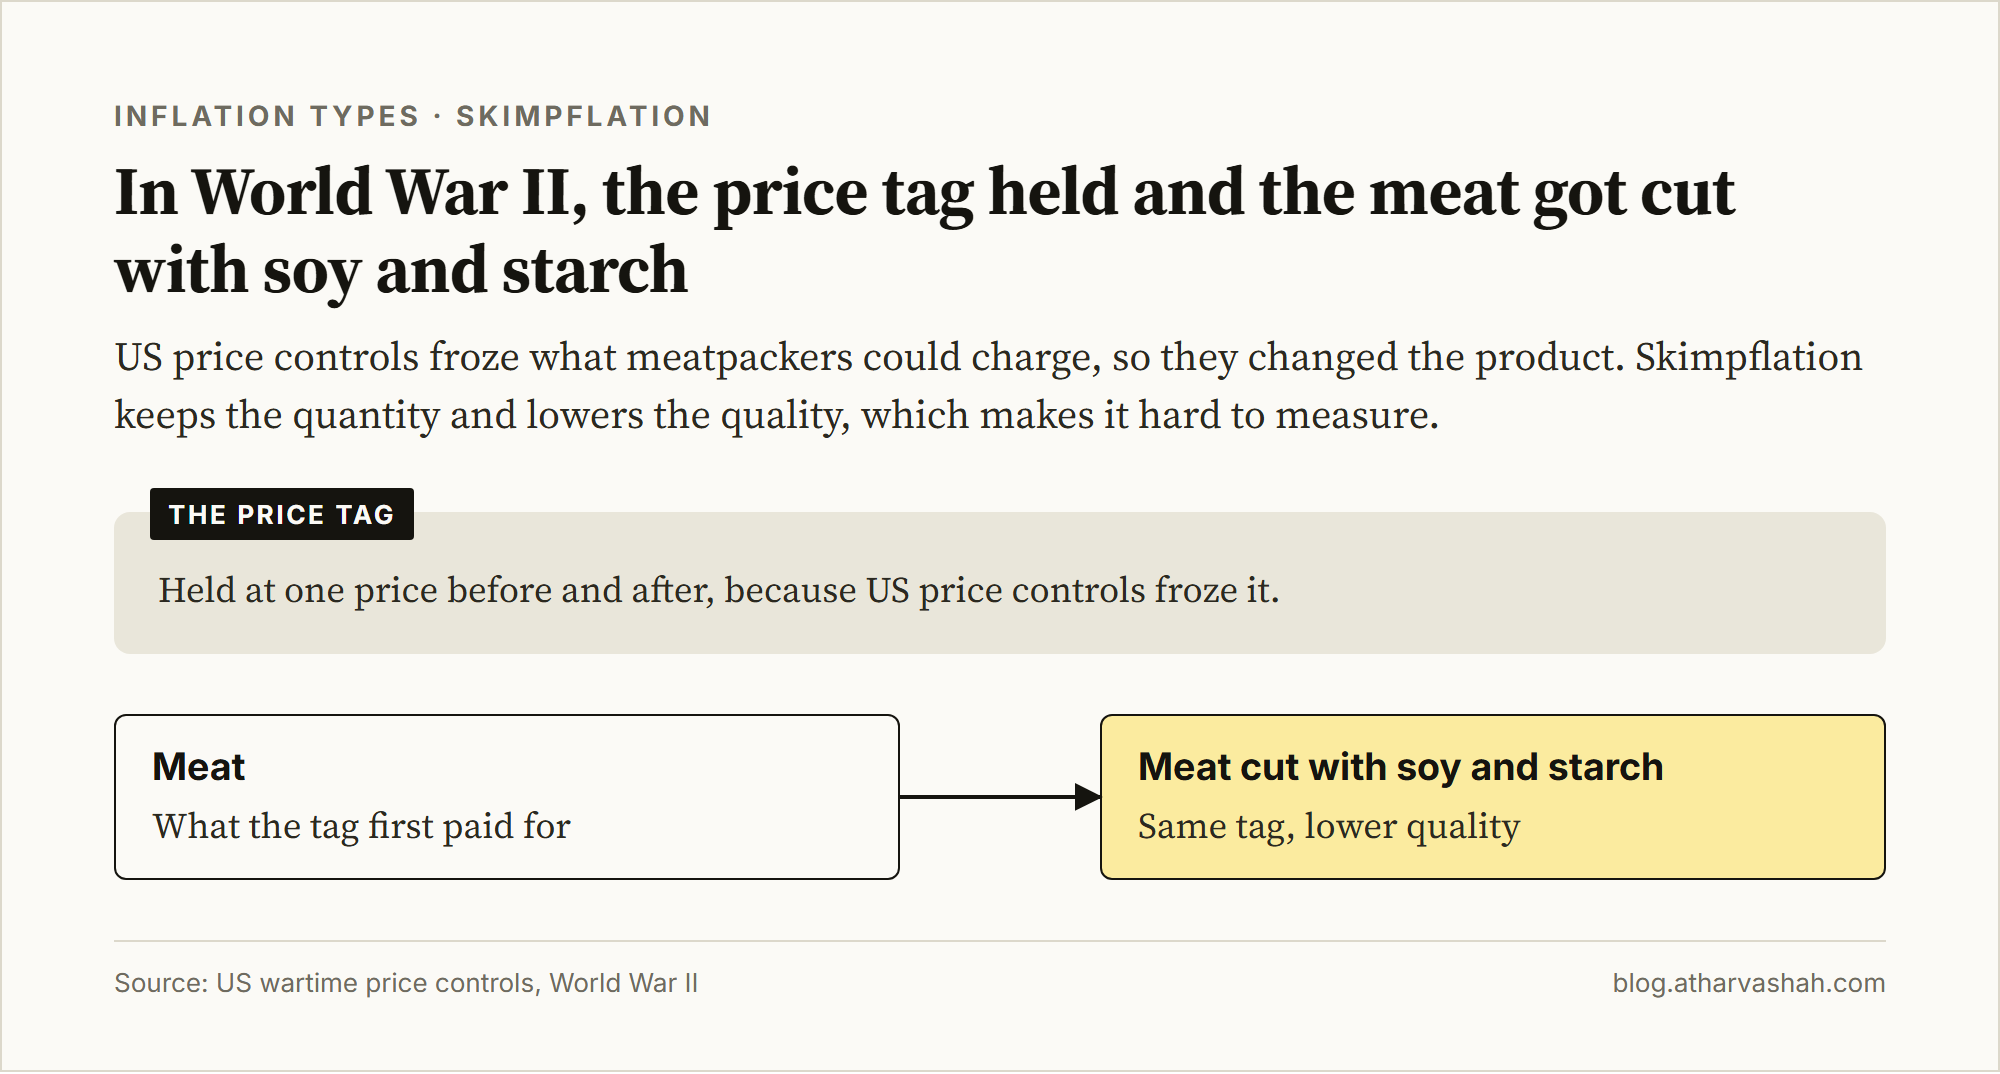
During World War II, US price controls froze what meatpackers could charge, so they moved on the product instead. They cut the meat with soy and starch and let the quality drop while the price tag held.
That is skimpflation: the price stays fixed and the product quietly gets worse. It holds on quantity and bleeds on quality, which makes it harder to measure than shrinkflation and easier for a company to deny.
Greedflation AKA the Margin Story Two Camps Argue Over
In 2024, the Groundwork Collaborative published a finding that corporate profits drove more than 53% of inflation between April and September 2023, against roughly 11% across the four decades before the pandemic.


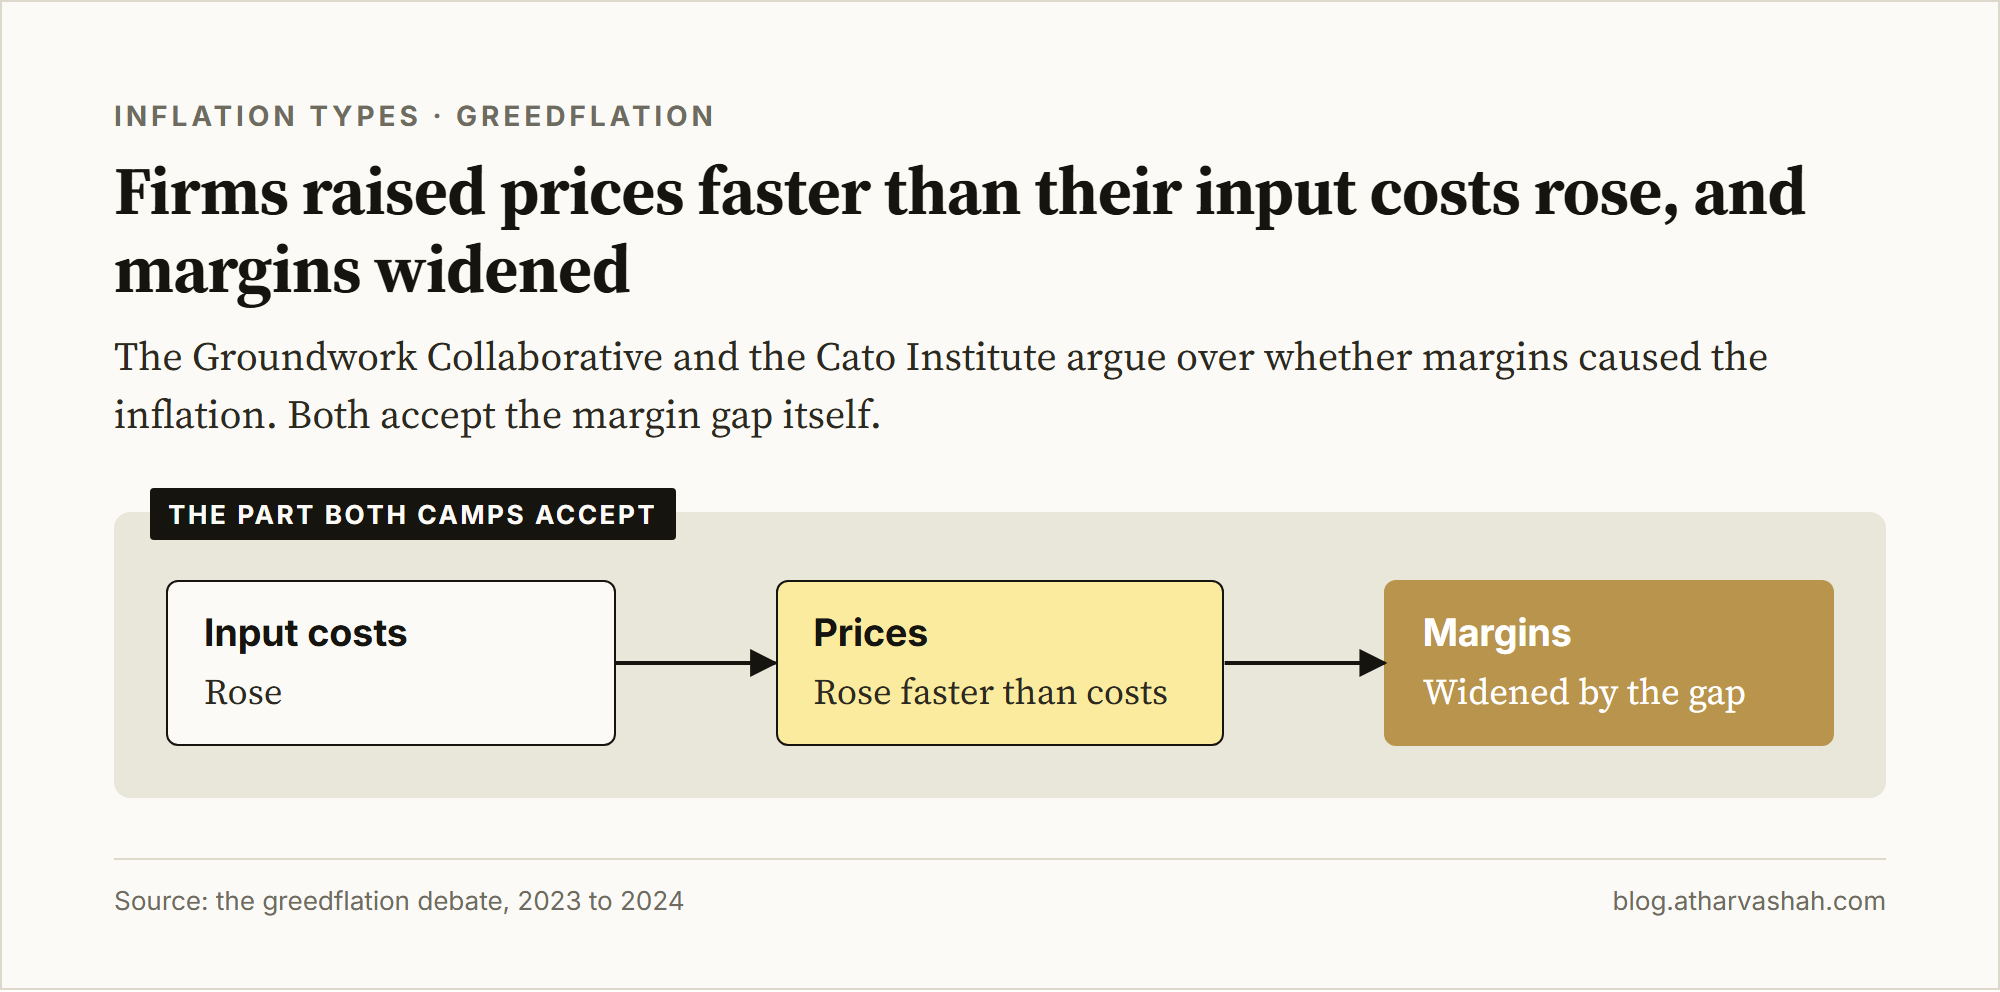
The claim is contested. The Cato Institute and several academic economists argue the accounting mistakes a margin residual for a cause. What both camps agree on is the observable part: firms raised prices faster than their input costs rose, and margins widened. Call that greed, opportunism, or ordinary market power. The mechanism underneath the label is the same.
Economist Noah Smith makes the case against the greedflation story.

Misdiagnosing 1970s Inflation Cost Eight Years
Monetary inflation responds to a rate hike. Imported inflation does not, because the cause sits outside the country raising rates. Greedflation needs competition policy, not a rate hike, and shrinkflation needs nothing from the Fed at all, because it is legal.
Arthur Burns, the Fed chair from 1970 to 1978, treated that decade's inflation as cost-push, driven by unions and oil prices, instead of monetary. He lobbied for wage and price controls rather than tightening policy, and prices rose at an annualized 6.5% across his eight years in the job. It took Paul Volcker's tightening, years later, to undo the delay.
Stephen Roach worked at the Fed under Burns and describes the mistake firsthand.

That single misdiagnosis is the real cost of treating seventeen different mechanisms as one number. Burns had roughly the same data anyone can read today. He read it wrong, and the country paid for it in years, not dollars.
Related reading: Goal Proximity: How Distance Shapes Decisions and Investing for Beginners: A Simple Starter Guide.



Wow, the explanation of headline vs. core inflation really stood out to me. How do you see these different types interacting in current EU policy? Such a briliant analysis!
This explains why policy responses feel incoherent. One tool cannot fix seventeen problems.